Help for taskbar-stats-screen and use of grid
Posted: Mon Dec 04, 2023 12:15 pm
I'm just starting out and familiarizing myself with Renpy. I understand the basics and have actually already solved my problem. But surely there must be a better and simpler way to do this!
As you can see in the picture, I have several fields that represent values. This is not an inventory with items (well maybe it is)... this are different point values, similar to properties.
I tried to display the whole thing using a grid, but it didn't work the way I wanted it to. The individual values should be centered in the fields and the text in them should also be centered.
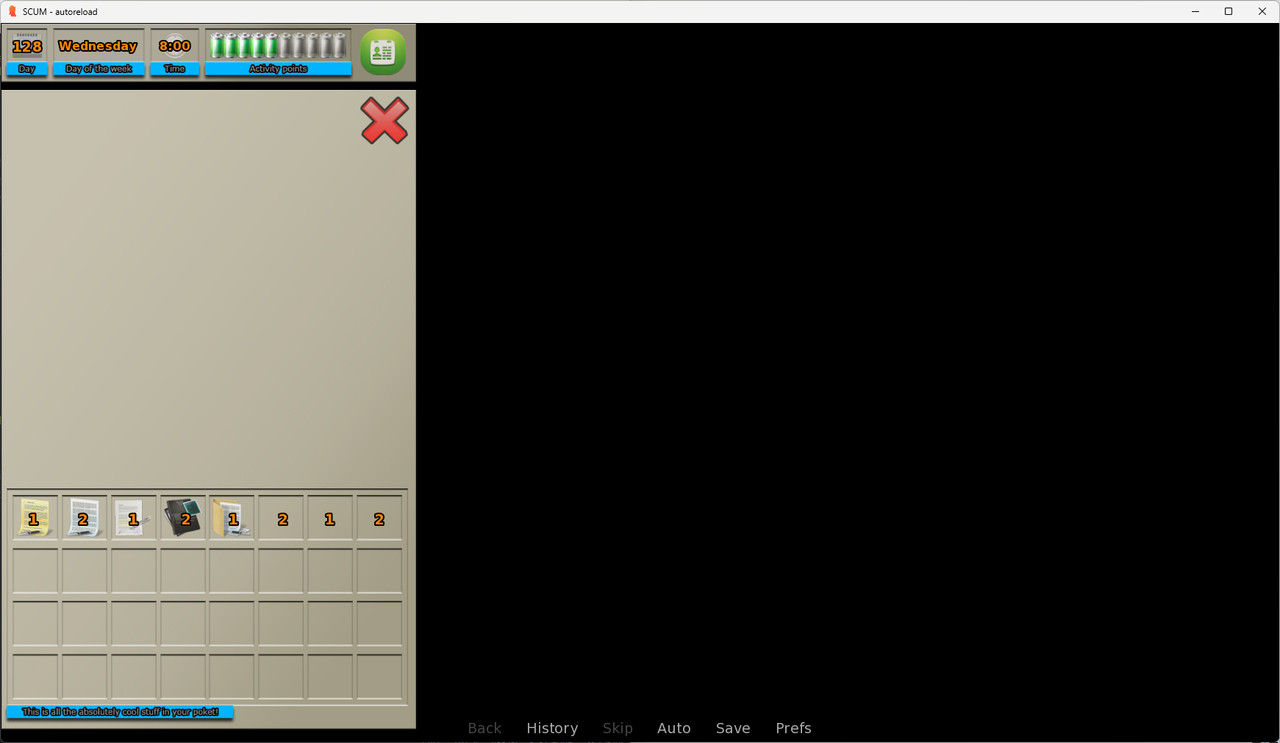
I went through some videos and explanations here in the forum, but... couldn't get it right. If anyone can help me make it easier to implement, I would be grateful.
As you can see in the picture, I have several fields that represent values. This is not an inventory with items (well maybe it is)... this are different point values, similar to properties.
I tried to display the whole thing using a grid, but it didn't work the way I wanted it to. The individual values should be centered in the fields and the text in them should also be centered.
Code: Select all
screen Taskbar():

    modal True
    zorder 10

    add "System/Taskbar/Taskbar.png" xpos 1 ypos 1

    text "[Day]" xpos 16 ypos 20 color "#F80" bold True size 22 outlines[(absolute(2), "#000", absolute(0), absolute(0))]
    text "[Weekday]" xpos 85 ypos 22 color "#F80" bold True size 18 outlines[(absolute(2), "#000", absolute(0), absolute(0))]
    text "[Time]:00" xpos 236 ypos 22 color "#F80" bold True size 18 outlines[(absolute(2), "#000", absolute(0), absolute(0))]

    bar:
        value AP
        range APmax
        left_bar "System/Taskbar/Task_AP_02.png"
        right_bar "System/Taskbar/Task_AP_01.png"
        xysize(204,39)
        xpos 315
        ypos 14

    imagebutton:
        xpos 540
        ypos 9
        auto "System/Taskbar/Btn_Task_Stats_%s.png"
        hovered [Play("sound", "audio/SND_Click_01.mp3")]
        action Show("StatsUI")


screen StatsUI:

    modal True
    zorder 11

    add "System/Taskbar/BG_Stats.png" xpos 1 ypos 100

    imagebutton:
        xpos 540
        ypos 110
        auto "System/Taskbar/Btn_Close_%s.png"
        hovered [Play("sound", "audio/SND_Click_01.mp3")]
        action Hide("StatsUI")

    # better use a grid... but how???
    text "[Item1]" xpos 40 ypos 730 color "#F80" bold True size 22 outlines[(absolute(2), "#000", absolute(0), absolute(0))]
    text "[Item2]" xpos 115 ypos 730 color "#F80" bold True size 22 outlines[(absolute(2), "#000", absolute(0), absolute(0))]
    text "[Item1]" xpos 190 ypos 730 color "#F80" bold True size 22 outlines[(absolute(2), "#000", absolute(0), absolute(0))]
    text "[Item2]" xpos 270 ypos 730 color "#F80" bold True size 22 outlines[(absolute(2), "#000", absolute(0), absolute(0))]
    text "[Item1]" xpos 340 ypos 730 color "#F80" bold True size 22 outlines[(absolute(2), "#000", absolute(0), absolute(0))]
    text "[Item2]" xpos 415 ypos 730 color "#F80" bold True size 22 outlines[(absolute(2), "#000", absolute(0), absolute(0))]
    text "[Item1]" xpos 485 ypos 730 color "#F80" bold True size 22 outlines[(absolute(2), "#000", absolute(0), absolute(0))]
    text "[Item2]" xpos 560 ypos 730 color "#F80" bold True size 22 outlines[(absolute(2), "#000", absolute(0), absolute(0))]